
In this tutorial, I will show you how to use R for creating a map of an Indian state with district boundaries. The state is Uttar Pradesh and it has 75 districts as of December 2023.
I will use a shapefile of India that has district-level boundaries for the entire country, so I will filter this data for Uttar Pradesh state.
Then I have another district-wise dataset that has information related to the number of houses built and delivered under Pradhan Mantri Awas Yojana – Gramin (PMAYG) in Uttar Pradesh for the period of 2021-2022.
PMAYG is a social welfare program, created by the Indian Government, to provide housing for the rural poor in India.
This dataset will be used with the shapefile data to visualize houses built in each district. Now let’s get started and open up RStudio.
About the datasets
- India district-boundary shapefile – https://onlinemaps.surveyofindia.gov.in/Digital_Product_Show.aspx
Find the data/file with the label “Entire country Upto Distt. level” and download it. It will be downloaded as a zip file, extract the zip in your working directory. - District-wise PMAYG Houses Data – https://tn.data.gov.in/resource/district-wise-pmayg-houses-constructed-state-uttar-pradesh-during-2021-22
R packages for geospatial analysis
I will use sf package in this tutorial to load and work with the shapefile. sf package is used to work with spatial vector data including points, polygons, and lines, and their attributes.
In addition, I will also use tidyverse package for performing data manipulation and ggplot2 for creating the map.
library(sf)
library(tidyverse)
library(ggplot2)
Load shapefile
Let’s load the district-boundary shapefile. Remember this file contains geospatial data for all the districts in India.
dist_geodata = st_read("DISTRICT_BOUNDARY.shp")
Filter geospatial data
Now I will filter this data for Uttar Pradesh with the help of dplyr. If you want to work with another state, simply insert that state’s name.
# filter data for "UTTAR PRADESH" state
up_dist_geodata = dist_geodata %>%
  filter(STATE == "UTTAR PRADESH")
You can plot a basic map by using plot() and st_geometry() functions.
# basic plot of districts
plot(st_geometry(up_dist_geodata))

This data has an attribute (column) called District that contains all the district names of Uttar Pradesh.
Load PMAYG houses dataset
Now I will load the PMAYG dataset into an R dataframe.
# load district data
df = read_csv("RS_Session_255_AU_427.2.csv")
Let’s look at the first few rows of this dataframe.
head(df)
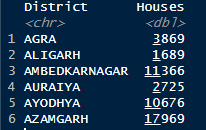
As you can see, there are only two columns in this data – ‘District’ and ‘Houses’. There were some mismatches between the district names in this data and the shapefile data. I fixed it manually.
Let’s join this data with the district-boundary data.
# data joining
up_dist_geodata_v2 = left_join(up_dist_geodata, df, by = 'District')
Plot map using ggplot2
Finally, I will use ggplot2 to plot the map of districts filled with colors representing the number of houses built during 2021-2022.
ggplot() + geom_sf(data = up_dist_geodata_v2, aes(fill = Houses)) +
  scale_fill_continuous(type = "viridis")

So, this the map of Uttar Pradesh and its districts. In case you want to make this map interactive then you can use Mapview package. It can easily create interactive maps from spatial data.


Thanks Prateek. The article is very useful. I used to build a map that shows state level sales data and share of business.