Objective of our Shiny web app
In this tutorial, I will teach you to build a R Shiny web app to perform exploratory data analysis (EDA) on any tabular data.
This app will allow you to upload a dataset (CSV file) and analyze its numeric and categorical features or variables with visualizations.
I decided to build this app because I work on many data analysis projects where I have to perform EDA to understand the data at hand. So, I was looking for a custom app that would help me in doing some basic analysis quickly.
I have also built a similar app using Streamlit and Python. You can check that out later.
Layout of the R Shiny web app
This Shiny app will have a sidebar containing a widget to upload the dataset CSV file.
On the main panel of the app, there will be three tabs:
- Data Info – Quick information about the dataset.
- Numeric Features – Descriptive statistics and visualizations of numeric features/columns of the dataset.
- Categorical Features – Descriptive statistics and visualizations of categorical features/columns of the dataset.

Download R Shiny code
If you can’t wait to run this Shiny app yourself, then download the entire R code from here and run it at your end.
Create a base layout for the R Shiny app
I will use the following R packages to build the web app:
- shiny
- readr
- dplyr
Make sure these are installed in your system.
So, I will now create a script file in RStudio. Save the script as app.R and use the code below to create the base layout of the app.
library(shiny)
library(readr)
library(dplyr)
library(ggplot2)

# Define UI
ui <- fluidPage(
  titlePanel("EDA Web App"),
  sidebarLayout(
    sidebarPanel(
      fileInput("file1", "Choose CSV File",
                accept = c(
                  "text/csv",
                  "text/comma-separated-values,text/plain",
                  ".csv")
      )
    ),
    mainPanel(
      tabsetPanel(
        tabPanel("Data Info", verbatimTextOutput("dataInfo")),
        tabPanel("Numeric Features", verbatimTextOutput("numericFeatures")),
        tabPanel("Categorical Features", verbatimTextOutput("categoricalFeatures"))
      )
    )
  )
)

server = function(input, output) { }

# Run the application
shinyApp(ui = ui, server = server)

As you can see, with the help of the R code above, I added a side panel, and inside it added a CSV file upload widget. Apart from that added three tabs on the main panel.
Add logic in Server function to read data
Now I will update the Server function of the Shiny app. The most important thing is to allow reading data from the uploaded CSV file.
For reading CSV files, we use the reactive expression, ensuring that the file is re-read each time a new file is uploaded.
In R Shiny, reactive expressions are smart about recomputation. They only re-execute when their dependencies change. This means if the input doesn’t change, the reactive expression won’t needlessly re-run its code, saving computational resources and making the app more responsive.
server <- function(input, output) {
  # Reactive expression to read uploaded file
  data <- reactive({
    inFile <- input$file1
    if (is.null(inFile)) {
      # Return NULL if no file is uploaded
      return(NULL)
    }
    read_csv(inFile$datapath)
  })
}
Define ‘Data Info’ tab in Server function
Let’s focus on the tabs now. I will add some logic to the ‘Data Info’ tab of my Shiny web app to display quick information about the dataset as soon as the CSV file is uploaded in the app.
Add a summary table
So, the updated Server function is given below:
server <- function(input, output) {
  # Reactive expression to read uploaded file
  data <- reactive({
    inFile <- input$file1
    if (is.null(inFile)) {
      # Return NULL if no file is uploaded
      return(NULL)
    }
    read_csv(inFile$datapath)
  })

  # Output Data Info as a Table
  output$dataInfo <- renderTable({
    if(is.null(data())) {
      return(data.frame(Information = "Please upload a CSV file.", Value = NA))
    } else {
      num_rows <- nrow(data())
      num_cols <- ncol(data())
      num_duplicate_rows <- sum(duplicated(data()))
      num_rows_with_na <- sum(apply(data(), 1, function(x) any(is.na(x))))
      num_cols_with_na <- sum(apply(data(), 2, function(x) any(is.na(x))))

      info_df <- data.frame(
        Information = c("Number of Rows", "Number of Columns", "Number of Duplicate Rows",
                        "Number of Rows with Missing Values", "Number of Columns with Missing Values"),
        Value = c(num_rows, num_cols, num_duplicate_rows, num_rows_with_na, num_cols_with_na)
      )
    }
  })
}
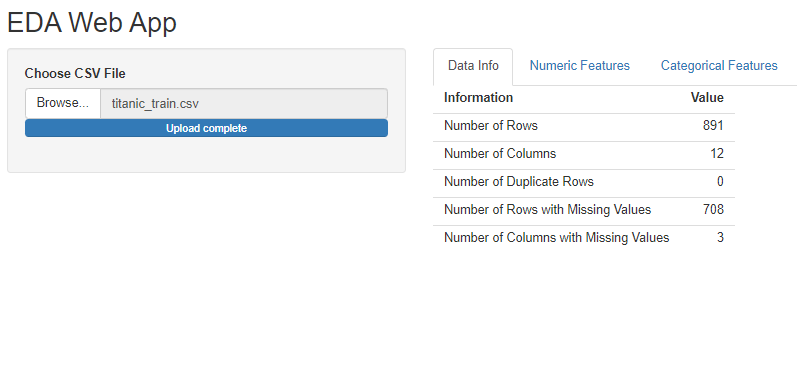
Information Calculation
nrow()andncol()are used to find the number of rows and columns, respectively.duplicated()followed bysum()calculates the number of duplicate rows.apply()withis.na()andany()in combination, iterated over rows (MARGIN = 1) and columns (MARGIN = 2), is used to count rows and columns with missing values, respectively.
Output Display: renderTable() is used to display the calculated information in tabular form in the “Data Info” tab. This function automatically renders a data frame as an HTML table in the Shiny app.
Now run the R Shiny web app again and upload a CSV file.
# Run the application
shinyApp(ui = ui, server = server)
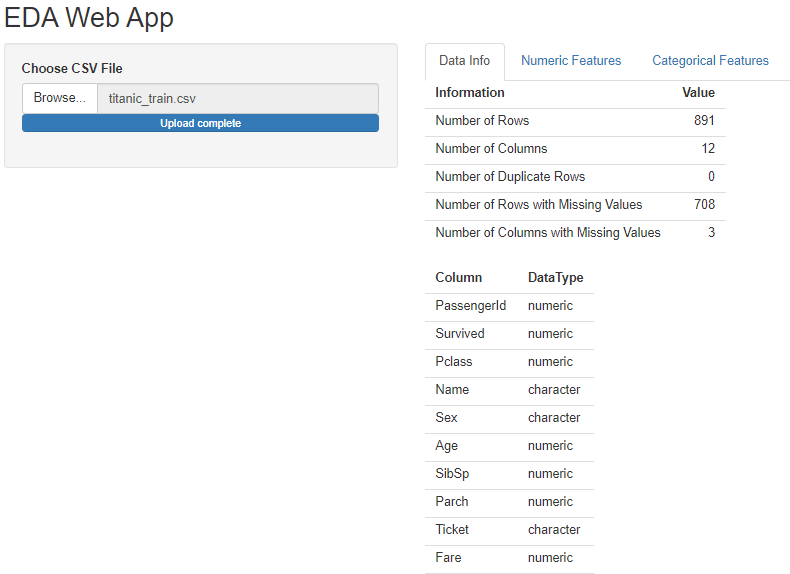
Add a column-datatype table
Next, I will update the Server logic again to generate and render a new table that will display each column’s name along with its data type. This involves creating a new renderTable expression.
server <- function(input, output) {
  # Reactive expression to read uploaded file
  data <- reactive({
    inFile <- input$file1
    if (is.null(inFile)) {
      # Return NULL if no file is uploaded
      return(NULL)
    }
    read_csv(inFile$datapath)
  })

  # Output Data Info as a Table
  output$dataInfo <- renderTable({
    if(is.null(data())) {
      return(data.frame(Information = "Please upload a CSV file.", Value = NA))
    } else {
      num_rows <- nrow(data())
      num_cols <- ncol(data())
      num_duplicate_rows <- sum(duplicated(data()))
      num_rows_with_na <- sum(apply(data(), 1, function(x) any(is.na(x))))
      num_cols_with_na <- sum(apply(data(), 2, function(x) any(is.na(x))))

      info_df <- data.frame(
        Information = c("Number of Rows", "Number of Columns", "Number of Duplicate Rows",
                        "Number of Rows with Missing Values", "Number of Columns with Missing Values"),
        Value = c(num_rows, num_cols, num_duplicate_rows, num_rows_with_na, num_cols_with_na)
      )
    }
  })

  # renderTable for displaying Column Names and Data Types
  output$colInfo <- renderTable({
    if(is.null(data())) {
      return(data.frame(Column = "No data available. Please upload a CSV file.", DataType = NA))
    } else {
      df <- data()  # Get the current data frame
      col_types <- sapply(df, class)  # Get data type of each column
      col_info_df <- data.frame(Column = names(df), DataType = col_types, stringsAsFactors = FALSE)
      return(col_info_df)
    }
  })
}

# Run the application
shinyApp(ui = ui, server = server)
Define ‘Numeric Features’ tab in Server function
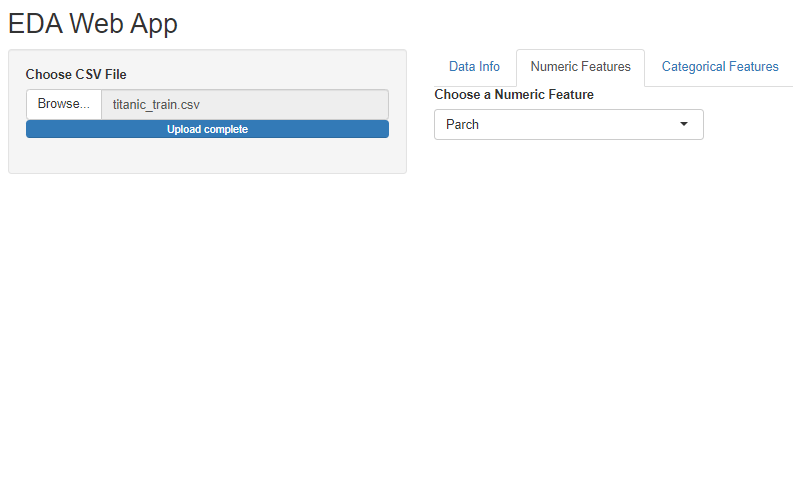
Moving on to the next tab of the R shiny app. Here in this tab, I want to show key information for only the numeric variables in the dataset.
There will be a dropdown selection list populated with all the numeric features. The user has to select any one of those features and then a table will be displayed with various information (mean, min,-max values, missing data, etc.) about the selected feature.
Add input selection from dropdown menu
I will use R Shiny’s updateSelectInput function to automatically populate a list with numeric feature names. The user can select any one item from this list.
I will use an observe expression here that is used to update the choices of selectInput dynamically based on the numeric columns of the uploaded dataset.
I will also add a new argument, session, to the Server function. Adding a parameter to the server function ensures that the server logic has access to the session-specific information and functionalities.
This is crucial for functions like updateSelectInput that rely on the session object to perform dynamic updates to the user interface.
server <- function(input, output, session) {
  # Reactive expression to read uploaded file
  data <- reactive({
    inFile <- input$file1
    if (is.null(inFile)) {
      # Return NULL if no file is uploaded
      return(NULL)
    }
    read_csv(inFile$datapath)
  })

  ## Tab 1 ##

  # Output Data Info as a Table
  output$dataInfo <- renderTable({
    if(is.null(data())) {
      return(data.frame(Information = "Please upload a CSV file.", Value = NA))
    } else {
      num_rows <- nrow(data())
      num_cols <- ncol(data())
      num_duplicate_rows <- sum(duplicated(data()))
      num_rows_with_na <- sum(apply(data(), 1, function(x) any(is.na(x))))
      num_cols_with_na <- sum(apply(data(), 2, function(x) any(is.na(x))))

      info_df <- data.frame(
        Information = c("Number of Rows", "Number of Columns", "Number of Duplicate Rows",
                        "Number of Rows with Missing Values", "Number of Columns with Missing Values"),
        Value = c(num_rows, num_cols, num_duplicate_rows, num_rows_with_na, num_cols_with_na)
      )
    }
  })

  # renderTable for displaying Column Names and Data Types
  output$colInfo <- renderTable({
    if(is.null(data())) {
      return(data.frame(Column = "No data available. Please upload a CSV file.", DataType = NA))
    } else {
      df <- data()  # Get the current data frame
      col_types <- sapply(df, class)  # Get data type of each column
      col_info_df <- data.frame(Column = names(df), DataType = col_types, stringsAsFactors = FALSE)
      return(col_info_df)
    }
  })


  ## Tab 2 ##

  # Dynamically update the choices for selectInput based on the uploaded file
  observe({
    df <- data()
    if (is.null(df)) return()
    numericCols <- names(select_if(df, is.numeric))
    updateSelectInput(session, "numericFeature", choices = numericCols)
  })

}

# Run the application
shinyApp(ui = ui, server = server)
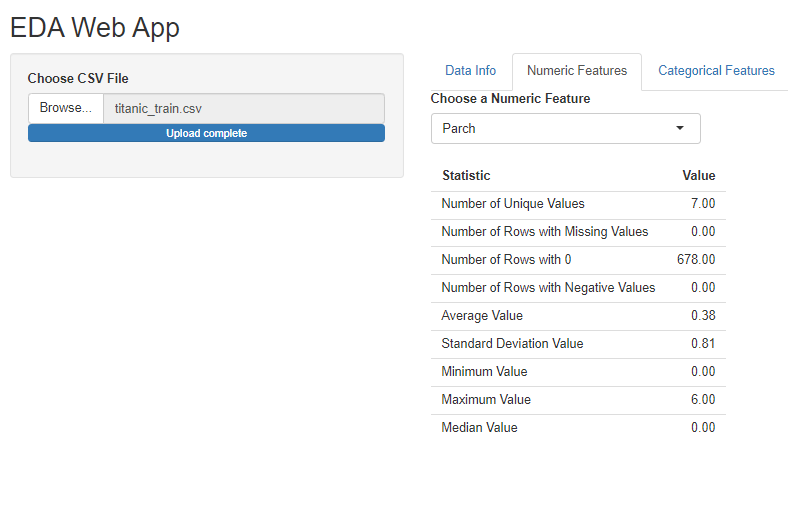
Add info table for numeric feature
Next, I’ll update the server logic to compute the statistics for the selected feature.
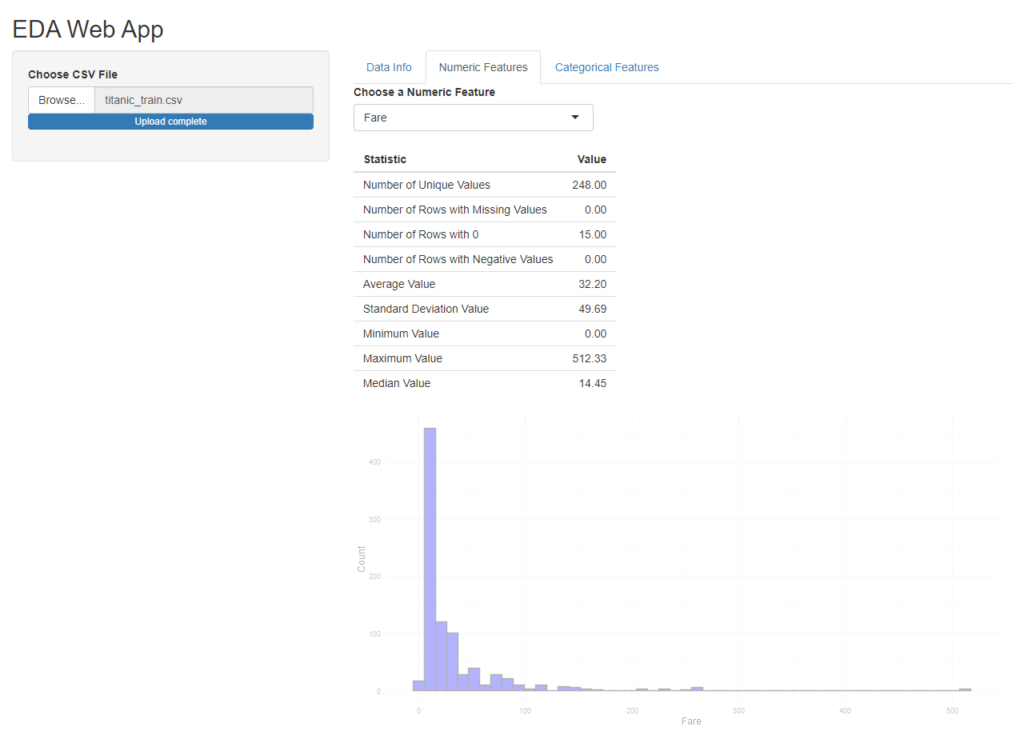
For the selected feature, various statistics are computed and displayed in a table. This includes counts of unique values, missing values, zeros, negative values, and basic descriptive statistics (mean, standard deviation, min, max, median).
server <- function(input, output, session) {
  # Reactive expression to read uploaded file
  data <- reactive({
    inFile <- input$file1
    if (is.null(inFile)) {
      # Return NULL if no file is uploaded
      return(NULL)
    }
    read_csv(inFile$datapath)
  })

  ## Tab 1 ##

  # Output Data Info as a Table
  output$dataInfo <- renderTable({
    if(is.null(data())) {
      return(data.frame(Information = "Please upload a CSV file.", Value = NA))
    } else {
      num_rows <- nrow(data())
      num_cols <- ncol(data())
      num_duplicate_rows <- sum(duplicated(data()))
      num_rows_with_na <- sum(apply(data(), 1, function(x) any(is.na(x))))
      num_cols_with_na <- sum(apply(data(), 2, function(x) any(is.na(x))))

      info_df <- data.frame(
        Information = c("Number of Rows", "Number of Columns", "Number of Duplicate Rows",
                        "Number of Rows with Missing Values", "Number of Columns with Missing Values"),
        Value = c(num_rows, num_cols, num_duplicate_rows, num_rows_with_na, num_cols_with_na)
      )
    }
  })

  # renderTable for displaying Column Names and Data Types
  output$colInfo <- renderTable({
    if(is.null(data())) {
      return(data.frame(Column = "No data available. Please upload a CSV file.", DataType = NA))
    } else {
      df <- data()  # Get the current data frame
      col_types <- sapply(df, class)  # Get data type of each column
      col_info_df <- data.frame(Column = names(df), DataType = col_types, stringsAsFactors = FALSE)
      return(col_info_df)
    }
  })


  ## Tab 2 ##

  # Dynamically update the choices for selectInput based on the uploaded file
  observe({
    df <- data()
    if (is.null(df)) return()
    numericCols <- names(select_if(df, is.numeric))
    updateSelectInput(session, "numericFeature", choices = numericCols)
  })

  # Compute and render the statistics table for the selected numeric feature
  output$featureStats <- renderTable({
    df <- data()
    if (is.null(df) || is.null(input$numericFeature)) {
      return(data.frame(Statistic = "Please upload a file and select a feature.", Value = NA))
    }
    feature <- df[[input$numericFeature]]

    stats <- data.frame(
      Statistic = c("Number of Unique Values", "Number of Rows with Missing Values",
                    "Number of Rows with 0", "Number of Rows with Negative Values",
                    "Average Value", "Standard Deviation Value",
                    "Minimum Value", "Maximum Value", "Median Value"),
      Value = c(length(unique(na.omit(feature))),
                sum(is.na(feature)),
                sum(feature == 0),
                sum(feature < 0),
                mean(feature, na.rm = TRUE),
                sd(feature, na.rm = TRUE),
                min(feature, na.rm = TRUE),
                max(feature, na.rm = TRUE),
                median(feature, na.rm = TRUE))
    )
  })
}

# Run the application
shinyApp(ui = ui, server = server)
Add a histogram
Let’s add a histogram as well using ggplot2. The histogram uses 50 bins in this Shiny app.
server <- function(input, output, session) {
  # Reactive expression to read uploaded file
  data <- reactive({
    inFile <- input$file1
    if (is.null(inFile)) {
      # Return NULL if no file is uploaded
      return(NULL)
    }
    read_csv(inFile$datapath)
  })

  ## Tab 1 ##

  # Output Data Info as a Table
  output$dataInfo <- renderTable({
    if(is.null(data())) {
      return(data.frame(Information = "Please upload a CSV file.", Value = NA))
    } else {
      num_rows <- nrow(data())
      num_cols <- ncol(data())
      num_duplicate_rows <- sum(duplicated(data()))
      num_rows_with_na <- sum(apply(data(), 1, function(x) any(is.na(x))))
      num_cols_with_na <- sum(apply(data(), 2, function(x) any(is.na(x))))

      info_df <- data.frame(
        Information = c("Number of Rows", "Number of Columns", "Number of Duplicate Rows",
                        "Number of Rows with Missing Values", "Number of Columns with Missing Values"),
        Value = c(num_rows, num_cols, num_duplicate_rows, num_rows_with_na, num_cols_with_na)
      )
    }
  })

  # renderTable for displaying Column Names and Data Types
  output$colInfo <- renderTable({
    if(is.null(data())) {
      return(data.frame(Column = "No data available. Please upload a CSV file.", DataType = NA))
    } else {
      df <- data()  # Get the current data frame
      col_types <- sapply(df, class)  # Get data type of each column
      col_info_df <- data.frame(Column = names(df), DataType = col_types, stringsAsFactors = FALSE)
      return(col_info_df)
    }
  })


  ## Tab 2 ##

  # Dynamically update the choices for selectInput based on the uploaded file
  observe({
    df <- data()
    if (is.null(df)) return()
    numericCols <- names(select_if(df, is.numeric))
    updateSelectInput(session, "numericFeature", choices = numericCols)
  })

  # Compute and render the statistics table for the selected numeric feature
  output$featureStats <- renderTable({
    df <- data()
    if (is.null(df) || is.null(input$numericFeature)) {
      return(data.frame(Statistic = "Please upload a file and select a feature.", Value = NA))
    }
    feature <- df[[input$numericFeature]]

    stats <- data.frame(
      Statistic = c("Number of Unique Values", "Number of Rows with Missing Values",
                    "Number of Rows with 0", "Number of Rows with Negative Values",
                    "Average Value", "Standard Deviation Value",
                    "Minimum Value", "Maximum Value", "Median Value"),
      Value = c(length(unique(na.omit(feature))),
                sum(is.na(feature)),
                sum(feature == 0),
                sum(feature < 0),
                mean(feature, na.rm = TRUE),
                sd(feature, na.rm = TRUE),
                min(feature, na.rm = TRUE),
                max(feature, na.rm = TRUE),
                median(feature, na.rm = TRUE))
    )

  })

  # Generate and render the histogram for the selected numeric feature
  output$featureHist <- renderPlot({
    df <- data()
    if (is.null(df) || is.null(input$numericFeature)) return()
    feature <- df[[input$numericFeature]]

    ggplot(data.frame(Feature = feature), aes(x = Feature)) +
      geom_histogram(bins = 50, fill = "blue", color = "black") +
      labs(x = input$numericFeature, y = "Count") +
      theme_minimal()
  })
}

# Run the application
shinyApp(ui = ui, server = server)
Feel free to add more charts as per your requirements.
Define ‘Categorical Features’ tab in Server function
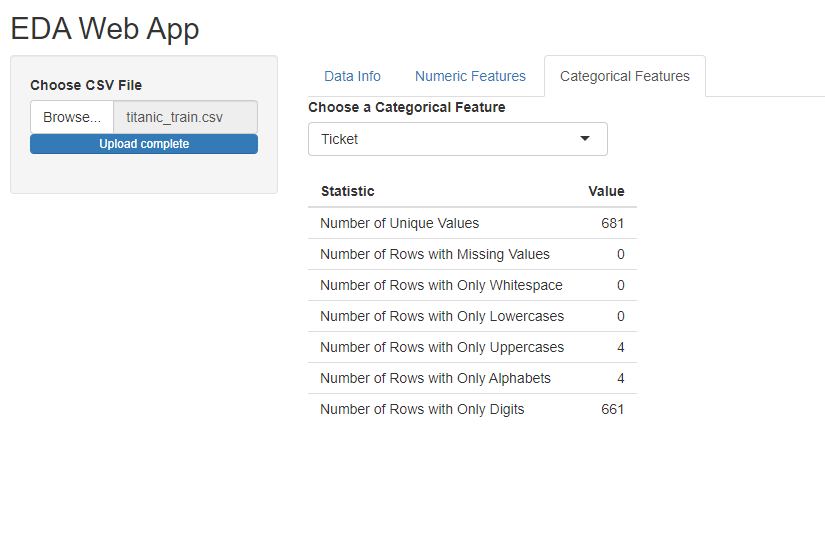
In addition to numeric features, categorical or non-numeric features are important. The values of such columns are text-based such as categories, grades, status labels, etc.
Under this new tab, I will first identify all the categorical columns and then use the same updateSelectInput function to let the user select a categorical column.
Then use a similar table to display key statistics of the selected categorical feature.
Check out the updated Server function below.
server <- function(input, output, session) {
  # Reactive expression to read uploaded file
  data <- reactive({
    inFile <- input$file1
    if (is.null(inFile)) {
      # Return NULL if no file is uploaded
      return(NULL)
    }
    read_csv(inFile$datapath)
  })

  ## Tab 1 ##

  # Output Data Info as a Table
  output$dataInfo <- renderTable({
    if(is.null(data())) {
      return(data.frame(Information = "Please upload a CSV file.", Value = NA))
    } else {
      num_rows <- nrow(data())
      num_cols <- ncol(data())
      num_duplicate_rows <- sum(duplicated(data()))
      num_rows_with_na <- sum(apply(data(), 1, function(x) any(is.na(x))))
      num_cols_with_na <- sum(apply(data(), 2, function(x) any(is.na(x))))

      info_df <- data.frame(
        Information = c("Number of Rows", "Number of Columns", "Number of Duplicate Rows",
                        "Number of Rows with Missing Values", "Number of Columns with Missing Values"),
        Value = c(num_rows, num_cols, num_duplicate_rows, num_rows_with_na, num_cols_with_na)
      )
    }
  })

  # renderTable for displaying Column Names and Data Types
  output$colInfo <- renderTable({
    if(is.null(data())) {
      return(data.frame(Column = "No data available. Please upload a CSV file.", DataType = NA))
    } else {
      df <- data()  # Get the current data frame
      col_types <- sapply(df, class)  # Get data type of each column
      col_info_df <- data.frame(Column = names(df), DataType = col_types, stringsAsFactors = FALSE)
      return(col_info_df)
    }
  })


  ## Tab 2 ##

  # Dynamically update the choices for selectInput based on the uploaded file
  observe({
    df <- data()
    if (is.null(df)) return()
    numericCols <- names(select_if(df, is.numeric))
    updateSelectInput(session, "numericFeature", choices = numericCols)
  })

  # Compute and render the statistics table for the selected numeric feature
  output$featureStats <- renderTable({
    df <- data()
    if (is.null(df) || is.null(input$numericFeature)) {
      return(data.frame(Statistic = "Please upload a file and select a feature.", Value = NA))
    }
    feature <- df[[input$numericFeature]]

    stats <- data.frame(
      Statistic = c("Number of Unique Values", "Number of Rows with Missing Values",
                    "Number of Rows with 0", "Number of Rows with Negative Values",
                    "Average Value", "Standard Deviation Value",
                    "Minimum Value", "Maximum Value", "Median Value"),
      Value = c(length(unique(na.omit(feature))),
                sum(is.na(feature)),
                sum(feature == 0),
                sum(feature < 0),
                mean(feature, na.rm = TRUE),
                sd(feature, na.rm = TRUE),
                min(feature, na.rm = TRUE),
                max(feature, na.rm = TRUE),
                median(feature, na.rm = TRUE))
    )

  })

  # Generate and render the histogram for the selected numeric feature
  output$featureHist <- renderPlot({
    df <- data()
    if (is.null(df) || is.null(input$numericFeature)) return()
    feature <- df[[input$numericFeature]]

    ggplot(data.frame(Feature = feature), aes(x = Feature)) +
      geom_histogram(bins = 50, fill = "blue", color = "black") +
      labs(x = input$numericFeature, y = "Count") +
      theme_minimal()
  })

  ## Tab 3 ##

  # Dynamically update the choices for categorical features selection
  observe({
    df <- data()
    if (is.null(df)) return()
    categoricalCols <- names(select_if(df, Negate(is.numeric)))
    updateSelectInput(session, "categoricalFeature", choices = categoricalCols)
  })

  # Compute and render the statistics for the selected categorical feature
  output$categoricalStats <- renderTable({
    df <- data()
    if (is.null(df) || is.null(input$categoricalFeature)) {
      return(data.frame(Statistic = "Please upload a file and select a feature.", Value = NA))
    }
    feature <- df[[input$categoricalFeature]]
    feature <- as.character(feature) # Ensure it's treated as character

    stats <- data.frame(
      Statistic = c("Number of Unique Values", "Number of Rows with Missing Values",
                    "Number of Rows with Only Whitespace", "Number of Rows with Only Lowercases",
                    "Number of Rows with Only Uppercases", "Number of Rows with Only Alphabets",
                    "Number of Rows with Only Digits"),
      Value = c(length(unique(na.omit(feature))),
                sum(is.na(feature)),
                sum(feature == "" | grepl("^\\s+$", feature)),
                sum(grepl("^[a-z]+$", feature)),
                sum(grepl("^[A-Z]+$", feature)),
                sum(grepl("^[a-zA-Z]+$", feature)),
                sum(grepl("^[0-9]+$", feature)))
    )

  })

}

# Run the application
shinyApp(ui = ui, server = server)
After making so many changes in the R code for the Server function, there were some changes made for the UI part as well. Find below the updated R code for UI.
ui <- fluidPage(
  titlePanel("EDA Web App"),
  sidebarLayout(
    sidebarPanel(
      fileInput("file1", "Choose CSV File",
                accept = c(
                  "text/csv",
                  "text/comma-separated-values,text/plain",
                  ".csv")
      )
    ),
    mainPanel(
      tabsetPanel(
        tabPanel("Data Info",
                 tableOutput("dataInfo"),
                 tableOutput("colInfo")),
        tabPanel("Numeric Features",
                 selectInput("numericFeature", "Choose a Numeric Feature", choices = NA),
                 tableOutput("featureStats"),
                 plotOutput("featureHist")),
        tabPanel("Categorical Features",
                 selectInput("categoricalFeature", "Choose a Categorical Feature", choices = NA),
                 tableOutput("categoricalStats"))
      )
    )
  )
)
You can add charts under the ‘Categorical Features’ tab as well, such as bar charts, heatmap, etc. If you have any questions, then let me know in the comments section below.