
Objective of our Streamlit web app
In this tutorial, I will teach you to build a Streamlit web app to perform exploratory data analysis (EDA) on any tabular data. In this app, we will be able to upload a dataset (CSV file) and analyze the numeric and categorical features of the dataset with only a few clicks.
I decided to build this app because I work on many data analysis projects where I have to perform EDA to understand the data at hand. So, I was looking for a custom app that would help me in doing some basic analysis quickly.
Being a big fan of Streamlit, I started using it to build this app and I thought why not share it with you. If you are an R Shiny, then you must check out this article where I have built the same app using Shiny.
Layout of the Streamlit web app
This Streamlit app will have a sidebar containing a widget to upload the dataset file.
On the main panel of the app, you can see that there are three tabs. I have defined each tab below:
- Data Info – Quick information about the dataset.
- Numeric Features – Descriptive statistics and visualizations of numeric features/columns of the dataset.
- Categorical Features – Descriptive statistics and visualizations of categorical features/columns of the dataset.

Create a GitHub repository
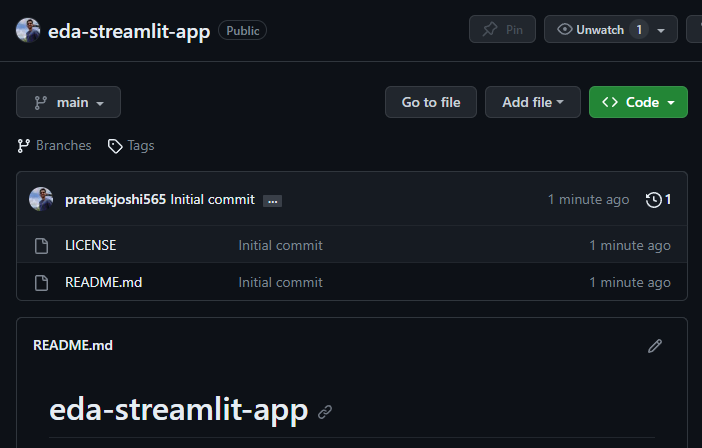
Let’s get started with the development of our Streamlit app. First of all, create a new repository in GitHub and give it a suitable name.
Start a GitHub Codespaces dev environment
GitHub Codespaces is a cloud computing service that we can use to use Python and build applications for free. In other words, we will develop the web app entirely on the cloud. However, if you want you can create the app on your local system as well.
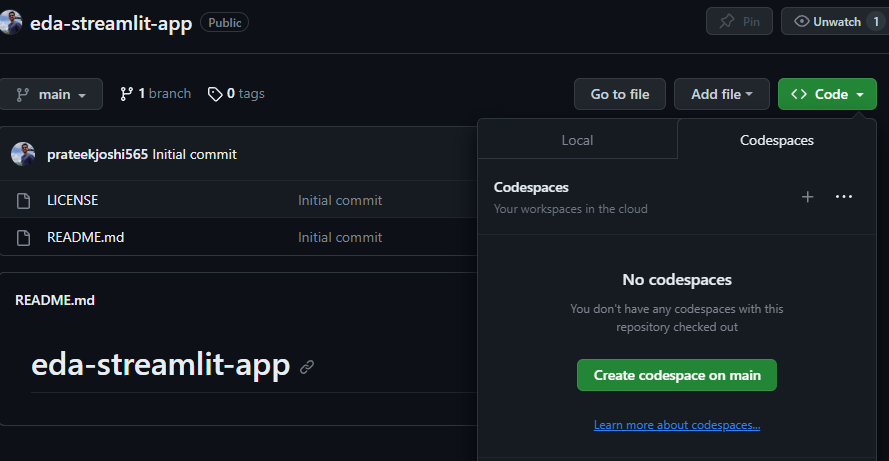
So, we will activate a Codespaces environment from the same GitHub repository.
Click on the green-colored button “Code” and then click on “Create codespace on main”
Create a base layout for the Streamlit app
Once the Codespace environment is activated, create a Python file – app.py
You can download the entire project from the link given at the end of the article.
Install Streamlit library in GitHub Codespaces
Now the first thing to do is to install the streamlit library if you are running your GitHub Codespaces environment for the first time.
So, in the terminal, at the bottom, run the following command.
pip install streamlit
Next time when restarting this environment you will not have to re-install the Streamlit library. The same is true for other libraries.
Add a title for the Streamlit app
Let’s add a title for our app. In app.py file write the following Python code and save the file.
import streamlit as st
import pandas as pd

# add title for the app
st.title("Exploratory Data Analysis")
This python file app.py alone is a Streamlit app. To run the app, use the command below in the terminal.
streamlit run app.py

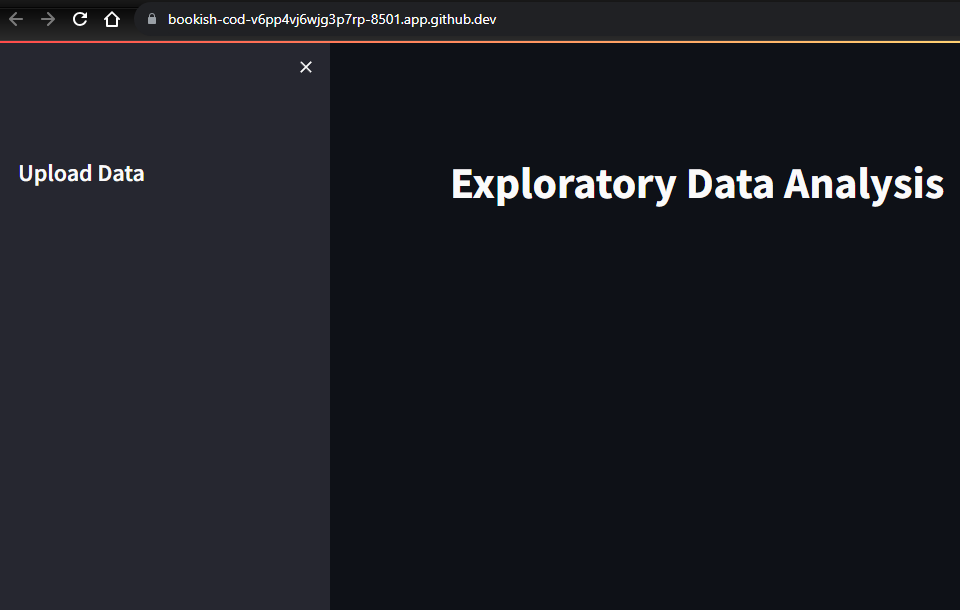
The user interface (UI) of the app will open in a new browser tab as shown below:

Add a sidebar
Let’s move on to the next step. We will add a sidebar to the web app. Also, add a title for the sidebar
# sidebar title
st.sidebar.title("Upload Data")
Add tabs to the main panel of the app
Add 2 tabs to the main panel of the Streamlit app. The names of the tabs are “DataFrame”, “Numeric Features”, and “Categorical Features”. We will add widgets, tables, and charts under each tab.
# add tabs
tab1, tab2, tab3 = st.tabs(["Data Info", "Numeric Features", "Categorical Features"])
Add file-upload widget in the sidebar
In Streamlit, we can easily add a widget to allow the uploading of different types of files. Here we will use the file_uploader function of Streamlit to add a CSV file uploader widget in the sidebar.
# add file-uploader widget in sidebar
uploaded_data = st.sidebar.file_uploader("Choose a CSV file")

You can now upload any CSV file to this Streamlit app.
Define a function to read CSV file
We can now define a function (load_data) to read the uploaded CSV file as a dataframe using pandas.
The decorator @st.cache_data is used to cache the dataframe. This will prevent the uploading of the data again while the app gets refreshed.
@st.cache_data
def load_data(file_name):
  # read CSV file
  data = pd.read_csv(file_name)
  return data

if uploaded_data is not None:
  #read csv
  df = load_data(uploaded_data)
Tab 1 – Display Dataset Information
Let’s use the first tab “Data Info” to display descriptive information about the dataset that will be uploaded to this Streamlit app.
Add a meta-data table
When I start working with new data, the first thing that I do is to check information like the number of rows and columns, number of duplicate rows, count of rows with missing values, etc.
This small task can be automated and the information can be displayed on the app. In Streamlit, we can use markdown tables, so let’s put the meta-data in a markdown table and show it on the front-end of the app.
with tab1:
if uploaded_data is not None:
# extract meta-data from the uploaded dataset
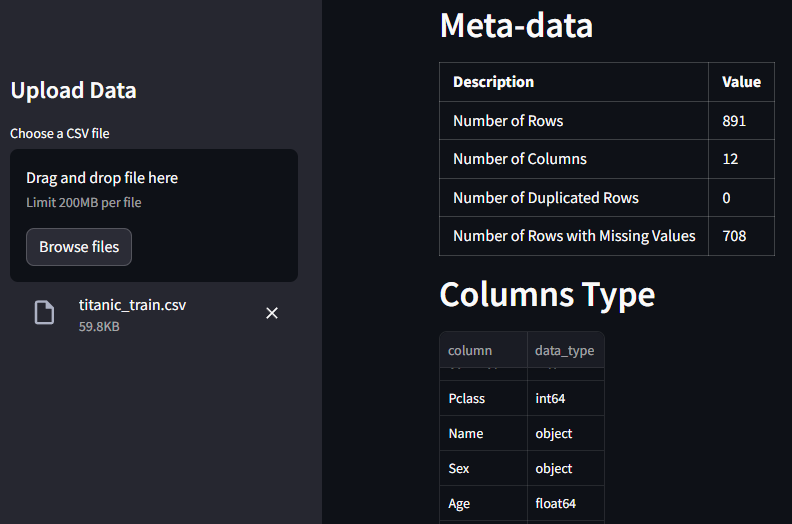
st.header("Meta-data")
row_count = df.shape[0]
column_count = df.shape[1]
# Use the duplicated() function to identify duplicate rows
duplicates = df[df.duplicated()]
duplicate_row_count = duplicates.shape[0]
missing_value_row_count = df[df.isna().any(axis=1)].shape[0]
table_markdown = f"""
| Description | Value |
|---|---|
| Number of Rows | {row_count} |
| Number of Columns | {column_count} |
| Number of Duplicated Rows | {duplicate_row_count} |
| Number of Rows with Missing Values | {missing_value_row_count} |
"""
st.markdown(table_markdown)
Let’s run the app again to see how the markdown table appearing.
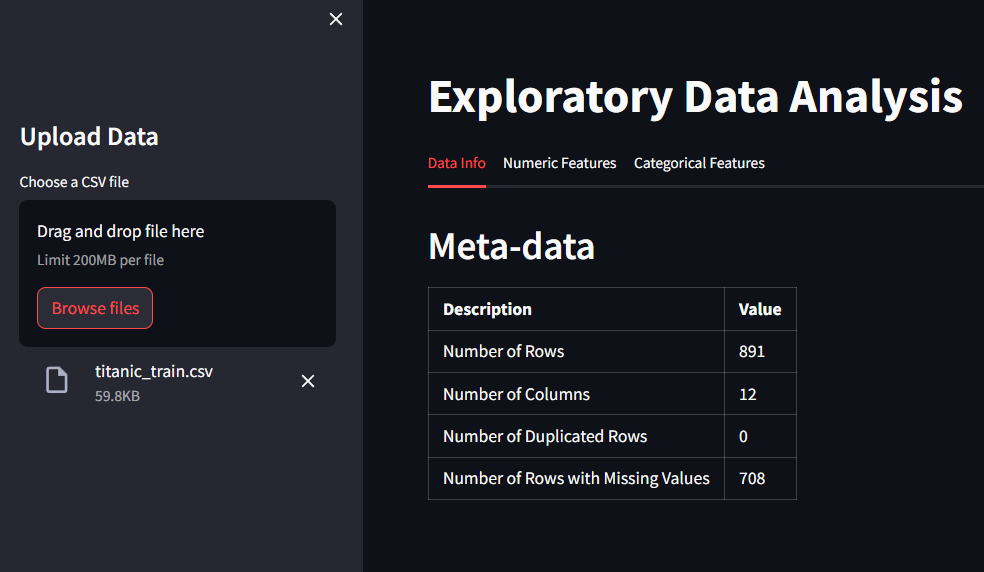
I uploaded the Titanic dataset CSV file and the markdown table appeared automatically with the information that we needed.
Add columns type table
Similarly, we can add more tables to help ourselves in extracting as much information as possible.
The following code is still for the first tab “Data info”.
st.header("Columns Type")

# get feature names
columns = list(df.columns)

# create dataframe
column_info_table = pd.DataFrame({
      "column": columns,
      "data_type": df.dtypes.tolist()
})

# display pandas dataframe as a table
st.dataframe(column_info_table, hide_index=True)
Commit and save code
Now let’s take a pause and try to commit our code. Once we commit a file, a snapshot of our work is saved and we can always come back to this snapshot if anything fails going forward.
So, in the terminal of the GitHub Codespaces environment use the command below to commit your code.
git add --all
git commit -m "Add tab 1 items"
Tab 2 – Display numeric features related information
Now let’s build the second tab of our app. This tab will be used to show information about the numeric columns of the uploaded dataset.
Find numeric features in the dataset
A tabular dataset can have different types of columns or features. So, before extracting insights from the numeric features we will first have to identify them in the dataset.
I have used pandas to identify numeric features in the dataframe.
with tab2:
  if uploaded_data is not None:
    # find numeric features  in the dataframe
    numeric_cols = df.select_dtypes(include='number').columns.tolist()
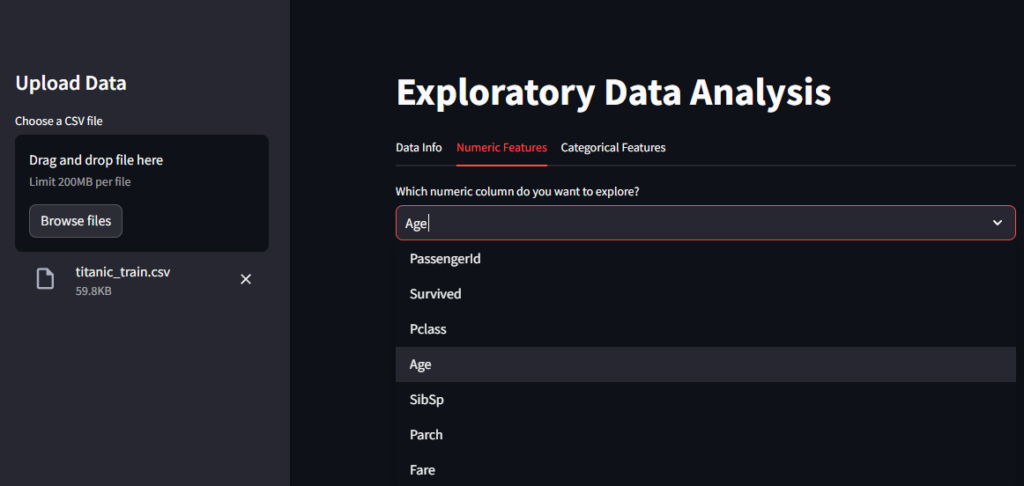
Add Streamlit Select widget
Once we have the list of numeric features, we will use the Select widget of Streamlit to let the user select any one of the numeric features.
The selected numeric feature’s info will then be displayed in this tab.
with tab2:
  if uploaded_data is not None:
    # find numeric features  in the dataframe
    numeric_cols = df.select_dtypes(include='number').columns.tolist()

    # add selection-box widget
    selected_num_col = st.selectbox("Which numeric column do you want to explore?", numeric_cols)
Add column statistics table
When we analyze and study the numeric features in a dataset, it is really helpful to look at certain statistics for the selected feature such as the number of unique values, count of rows with missing values, average value, minimum value, maximum value, and a few more.
Hence, it will be valuable to add these statistics to the app. We will again use a markdown table to display this information.
st.header(f"{selected_num_col} - Statistics")

col_info = {}
col_info["Number of Unique Values"] = len(df[selected_num_col].unique())
col_info["Number of Rows with Missing Values"] = df[selected_num_col].isnull().sum()
col_info["Number of Rows with 0"] = df[selected_num_col].eq(0).sum()
col_info["Number of Rows with Negative Values"] = df[selected_num_col].lt(0).sum()
col_info["Average Value"] = df[selected_num_col].mean()
col_info["Standard Deviation Value"] = df[selected_num_col].std()
col_info["Minimum Value"] = df[selected_num_col].min()
col_info["Maximum Value"] = df[selected_num_col].max()
col_info["Median Value"] = df[selected_num_col].median()

info_df = pd.DataFrame(list(col_info.items()), columns=['Description', 'Value'])

# display dataframe as a markdown table
st.dataframe(info_df)

Add a histogram chart for numeric feature
I would also like to add a histogram in the current tab because histograms provide many useful insights. You can see the distribution of the selected numeric feature, minimum-maximum values, and most frequent values in a single chart.
I have used the Plotly library but you can use other plotting libraries as well like Altair, Matplotlib, Bokeh, etc.
st.header("Histogram")
fig = px.histogram(df, x=selected_num_col)
st.plotly_chart(fig, use_container_width=True)
Again run the app and scroll down a bit under the second tab, you will find the histogram for your selected numeric feature.

Awesome! We can further add more tables and charts as per our requirement under this tab. I will now move to the third tab – Categorical Features.
Tab 3 – Display categorical features related information
In addition to numeric features, categorical or non-numeric features are also quite important. The values of such columns are text-based such as categories, grades, status labels, etc.
Under this new tab, we will first identify all the categorical columns and then use the Select widget to let the user select a categorical column.
We will then use a similar table to display key statistics of the selected categorical feature.
Add select widget and column statistics table
with tab3:
  if uploaded_data is not None:
    # find categorical columns in the dataframe
    cat_cols = df.select_dtypes(include='object')
    cat_cols_names = cat_cols.columns.tolist()

    # add select widget
    selected_cat_col = st.selectbox("Which text column do you want to explore?", cat_cols_names)

    st.header(f"{selected_cat_col}")

    # add categorical column stats
    cat_col_info = {}
    cat_col_info["Number of Unique Values"] = len(df[selected_cat_col].unique())
    cat_col_info["Number of Rows with Missing Values"] = df[selected_cat_col].isnull().sum()
    cat_col_info["Number of Empty Rows"] = df[selected_cat_col].eq("").sum()
    cat_col_info["Number of Rows with Only Whitespace"] = len(df[selected_cat_col][df[selected_cat_col].str.isspace()])
    cat_col_info["Number of Rows with Only Lowercases"] = len(df[selected_cat_col][df[selected_cat_col].str.islower()])
    cat_col_info["Number of Rows with Only Uppercases"] = len(df[selected_cat_col][df[selected_cat_col].str.isupper()])
    cat_col_info["Number of Rows with Only Alphabet"] = len(df[selected_cat_col][df[selected_cat_col].str.isalpha()])
    cat_col_info["Number of Rows with Only Digits"] = len(df[selected_cat_col][df[selected_cat_col].str.isdigit()])
    cat_col_info["Mode Value"] = df[selected_cat_col].mode()[0]

    cat_info_df = pd.DataFrame(list(cat_col_info.items()), columns=['Description', 'Value'])
    st.dataframe(cat_info_df)

We can add more tables and charts here as well like how we did in the previous tabs.
Create requirements.txt
To deploy a Stremlit app it is mandatory to have a requirements.txt file in the same repo. This text file should contain the names of all the libraries that you have used in your Streamlit app along with their version numbers.

Once you are done do not forget to commit your code and click on “Sync Changes” under the Source Control icon at the sidebar as depicted below.
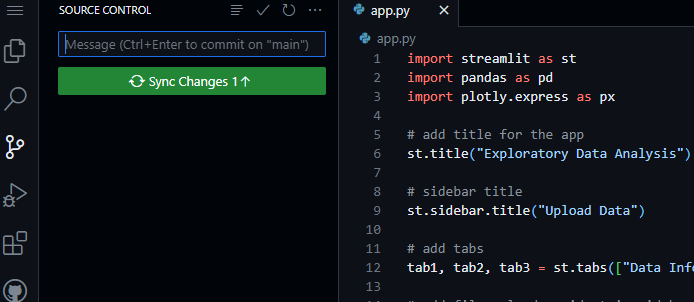
This will allow the changes you made in the files to be reflected in the GitHub repo.
Download Code
You can download the entire project from here and feel free to build upon it or modify it. If you face any issues then please drop a comment below.