Comprehensive Guide On Bokeh Scatter Plot
Deep dive into creating bokeh scatter plot in Python. A comprehensive tutorial on data visualization with Bokeh.

Deep dive into creating bokeh scatter plot in Python. A comprehensive tutorial on data visualization with Bokeh.

A comprehensive tutorial on Plotly heatmaps with Python examples.

Tutorial on visualizing Plotly charts side by side in an Streamlit web app.

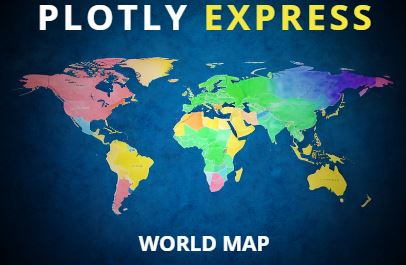
Plotly Express offers an intuitive and robust tool for creating interactive visualizations including geospatial plots.

Build an interactive Shiny dashboard app using R to explore the California housing prices dataset