
What is an infographic?
An infographic, short for “information graphic,” is a visual representation of data, information, or knowledge that aims to simplify complex ideas or concepts and present it in an easily digestible, engaging, and memorable format.
Infographics are immensely popular in various fields, such as marketing, education, journalism, and data analysis, due to their ability to communicate information quickly and effectively.
Infographics combine various design elements, such as charts, diagrams, icons, and text, to tell a story or convey a message through the effective use of visual cues.
In this article, we will use Python to generate infographics.
Why use Python for infographics?
Python is an excellent choice to create infographics for several reasons. Here are some of the key advantages of using Python for infographics:
1. Versatility: Python is a versatile programming language with a vast ecosystem of libraries and tools designed for various purposes, including data visualization, data manipulation, and statistical analysis. This makes it an ideal choice for creating a wide range of infographic elements, such as charts, maps, and interactive visualizations.
2. Ease of Use: Python is known for its readability and ease of use, making it an accessible language for beginners and experts alike. This means that even those with limited programming experience can create infographics using Python. Additionally, Python’s extensive documentation and rich community support make it easier for users to find solutions to their problems and learn new techniques.
3. Scalability: Python’s ability to handle large datasets and work efficiently with complex calculations makes it a suitable choice for creating scalable infographics. As your data and visualization needs grow, Python can easily accommodate these changes without sacrificing performance or quality.
4. Integration with Data Sources: Python can connect to various data sources, such as databases, APIs, web scraping tools, and data file formats like CSV, Excel, and JSON. This makes it easy to retrieve, process, and visualize data from various sources to create informative and engaging infographics.
5. Automation: Python allows for automation of data processing and visualization tasks. This is particularly useful when dealing with large datasets or when creating multiple infographics with different data inputs.
Now let’s get ready to create our first Python infographic.
Prerequisites
1. Python installation – Version 3.6 or above or Google Colab
2. Python Libraries – PIL, matplotlib, and io
3. Font file – We will be using Arial font to add text to our infographic. You can download the file from here.
Implementation in Python
You can download the Jupyter notebook containing the entire code along with the image files from this link.
Import Python libraries
from PIL import Image, ImageDraw, ImageFont
import matplotlib.pyplot as plt
import io
Load images
We will be using two images for this demo. The larger image will be used as the background image and the smaller image is that of a logo that will overlayed on the background image.
# load the background image
background_image = Image.open("bg_image.jpg")

# load the foreground image
foreground_image = Image.open("logo.png")

# dislay background image
plt.imshow(background_image);
This is our background image. We will put other images, charts, and text items on this background. Now let’s check out the logo image.
# Resize the foreground image to 300x300 pixels
foreground_image = foreground_image.resize((300, 300))
plt.imshow(foreground_image);
This is a logo image that we will put on the background image. Its size is 300px by 300px.
Put logo on background image
# Paste the foreground image onto the background image at position (120, 250)
background_image.paste(foreground_image, (120, 250))

# display image
plt.imshow(background_image);
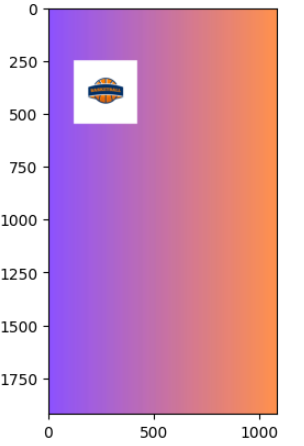
To put any image on top of another image, we have to specify the coordinates for the top-left corner of the foreground image. In this case, we have used the coordinates of (120, 250).
Let’s put the same logo again on the background image at a different position.
# Paste the foreground image again onto the background image at a different position (660, 250)
background_image.paste(foreground_image, (660, 250))

# display image
plt.imshow(background_image);
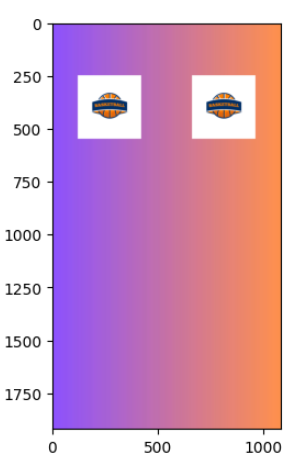
So, this is how we can put multiple images or logos on the background image and easily create a large number of infographics in quick time.
Add text to infographic
Now let’s add some text to our infographic. Make sure you have the arial.ttf font file in your working directory.
# Create a new image to draw the text on
# The size of this image is same as that of the background image
text_image = Image.new("RGBA", background_image.size, (0, 0, 0, 0))

# Set up the text drawing parameters
text_draw = ImageDraw.Draw(text_image)
text_color = (255, 255, 255)
text_position = (120, 600)
text_message = "Hello World"
text_font = ImageFont.truetype("arial.ttf", 144)
We will add “Hello World” to the background image just below the two logos.
# Draw the text on the image
text_draw.text(text_position, text_message, fill=text_color, font= text_font)

# Combine the background image and text image
combined_image = Image.alpha_composite(background_image.convert("RGBA"), text_image)

# display combined image
plt.imshow(combined_image);
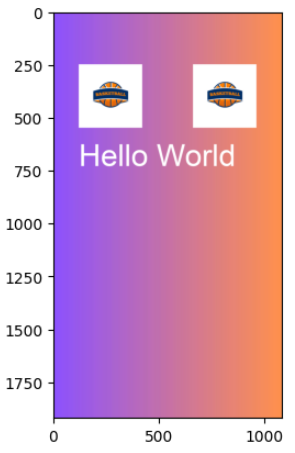
Awesome! Now we have a text string along with two logo images on our infographic. Let’s try to add a chart on the infographic as well.
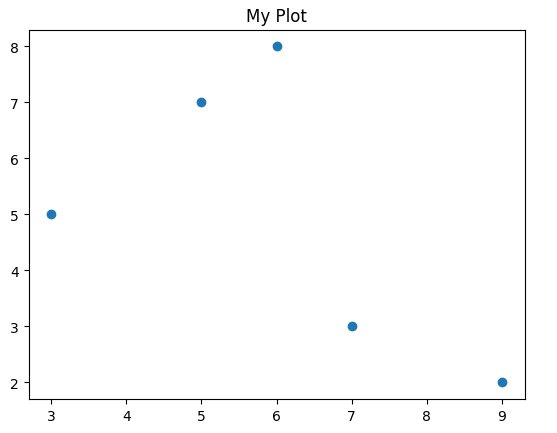
Create a Scatter Plot
You can any chart of your choice on the infographic. Let’s add a scatter plot.
# create a sample data
x = [5, 7, 3, 6, 9]
y = [7, 3, 5, 8, 2]

# create a scatter plot
plt.scatter(x, y)
plt.title("My Plot")

# convert the matplotlib plot to an image
buf = io.BytesIO()
plt.savefig(buf, format='png')
buf.seek(0)

# load the chart as an image
plot_img = Image.open(buf)
Overlay plot on infographic
# Resize the foreground image to 960x720 pixels
plot_img = plot_img.resize((960, 720))

# Paste the foreground image again onto the background image at a different position (60, 1000)
combined_image.paste(plot_img, (60, 1000))

# display combined image
plt.figure(figsize= (12, 8))
plt.imshow(combined_image);
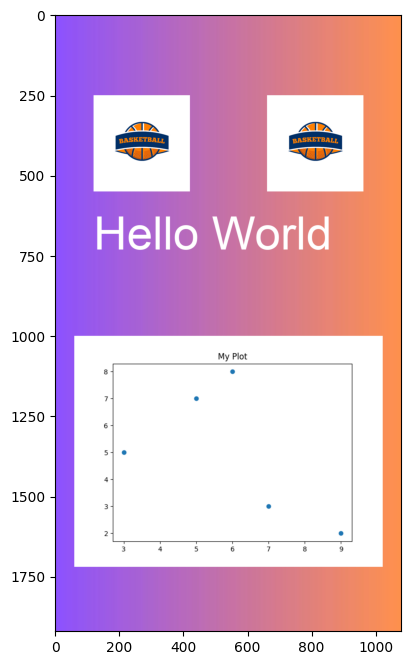
As you can see, we can easily put different types of elements on a background image using Python and create a handy infographic. Feel free to change the size of the background image and add more elements to create a compelling infographic.
Conclusion
Python offers a powerful and accessible solution for generating creatives and infographics that effectively communicate complex information in a visually engaging and easy-to-understand format.
With Python’s extensive ecosystem of libraries and tools, Python enables users to create a wide range of infographic elements and customize them according to their needs.
The ability to integrate with various data sources, automate tasks, and create interactive visualizations further enhances the appeal of Python for infographics. Regardless of your level of programming expertise, Python can help you create captivating and informative infographics that effectively convey your message and reach a wider audience.
So, start exploring the world of Python-infused infographics and unlock the full potential of data visualization.


[…] If you want to create infographics at scale and use them as your video grames, then you must check out our article on generating infographics using Python. […]