How to Visualize Charts Side by Side in Streamlit App?
Tutorial on visualizing Plotly charts side by side in an Streamlit web app.

Tutorial on visualizing Plotly charts side by side in an Streamlit web app.

In this tutorial, we will perform sales analysis using DuckDB and Python

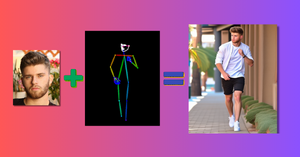
Image generation in custom poses using IP-Adapters and Diffusers Library

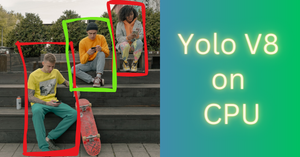
Perform fast object detection on images using the state-of-the-art YOLO V5 model on Google Colab CPU. We will use the DeepSparse library to accelerate model inference.

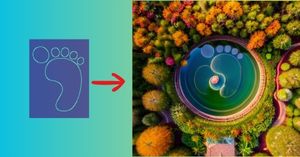
In the previous article we used Stable Diffusion (SD) and ControlNet to transform a logo into a natural looking image. But now, let’s push the boundaries even further. Imagine you […]

In this tutorial, we will use Stable Diffusion, ControlNet and the Diffusers Python library to merge a logo into an AI generated image. To run Stable Diffusion models you need […]