Introduction
Welcome! In this tutorial, we will perform sales analysis using DuckDB and Python.
Sales analysis is a vital process for any business that wants to optimize its sales performance, identify new opportunities, and understand customer behavior.
However, sales analysis can be challenging when dealing with large and complex datasets, especially if you want to perform fast and interactive queries.
That’s where DuckDB comes in handy. DuckDB is an in-process SQL OLAP database management system that is designed for analytical query processing.
It is fast, simple, feature-rich, and free to use. It also has a Python API that allows you to integrate it with your existing data analysis tools and workflows.
In this article, we will cover the following topics:
- How to install and import DuckDB in Python (Colab)
- How to load and query data from CSV files using DuckDB
- How to perform common sales analysis tasks such as calculating revenue, conversion rate, margin analysis, and more
About the dataset
This dataset comprises details of daily sales transactions carried out by sales staff within a retail establishment, covering the period from 2017 to 2022. You can download the dataset from here.
Attributes of dataset
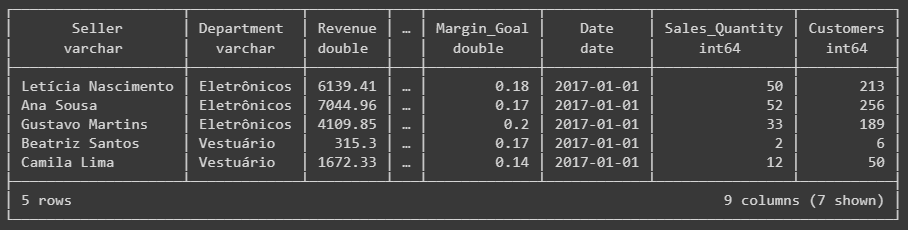
- Seller: Salesperson’s name.
- Department: Department to which the salesperson belongs.
- Revenue: Revenue generated by the salesperson on the respective day.
- Revenue Goal: Salesperson’s revenue goal for the respective day.
- Margin: Gross profit margin achieved by the salesperson on the respective day.
- Margin Goal: Salesperson’s profit margin goal for the respective day.
- Date: Date on which the sales were recorded.
- Sales Quantity: Number of customers who actually made a purchase.
- Customers: Total number of customers served.
Install and import DuckDB in Colab
We will use DuckDB in Google Colab for this tutorial. You may use your own system or any other cloud Python environment.
!pip install duckdb
import duckdb
Load and Query Data from CSV Files using DuckDB
Next, we will load the CSV file of the sales dataset using DuckDB and run a few SQL queries.
df = duckdb.read_csv('department_store_dataset.csv')

# query data
duckdb.sql('SELECT * FROM df LIMIT 5')
Output:
1. Revenue Analysis
Let’s aggregate revenue by sellers using DuckDB.
duckdb.sql('SELECT Seller, ROUND(SUM(Revenue)/1000000, 2) AS Total_Revenue FROM df GROUP BY Seller ORDER BY Total_Revenue DESC')
Output:

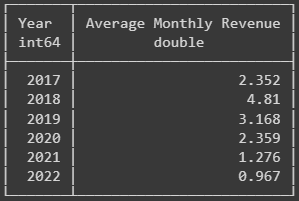
Let’s also check the average monthly revenue (in millions), year-wise.
query = """
SELECT
  Year,
  ROUND(AVG(Monthly_Revenue)/1000000, 3) AS "Average Monthly Revenue"
FROM
  (
    SELECT
      EXTRACT(YEAR FROM Date) AS "Year",
      EXTRACT(MONTH FROM Date) AS "Month",
      SUM(Revenue) AS "Monthly_Revenue"
    FROM
      df
    GROUP BY
      "Year", "Month"
  ) AS SubQuery
GROUP BY
  "Year"
ORDER BY
  "Year"
"""

duckdb.sql(query)
Output:
2. Margin Analysis
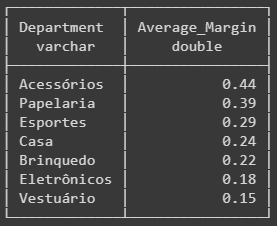
Average gross profit margin department-wise for year 2021
query = """
SELECT
    Department,
    ROUND(AVG(Margin),2) AS "Average_Margin"
FROM
    df
WHERE
    EXTRACT(YEAR FROM Date) = 2021
GROUP BY
    Department
ORDER BY
    Average_Margin DESC
"""

duckdb.sql(query)
Output:
Average gross profit margin month-wise for year 2021.
query = """
SELECT
    MONTH(Date) AS "Sales_Month",
    ROUND(AVG(Margin),2) AS "Average_Margin"
FROM
    df
WHERE
    EXTRACT(YEAR FROM Date) = 2021
GROUP BY
    Sales_Month
ORDER BY
    Sales_Month
"""

duckdb.sql(query)
Output:

3. Salesperson Performance Analysis
Now we will evaluate the performance of individual salespersons.
query = """
SELECT
    Seller,
    ROUND(SUM(Revenue)/1000000,2) AS Total_Revenue,
    ROUND(AVG(Margin),2) AS Average_Margin,
    ROUND((SUM(Revenue)/SUM(Revenue_Goal)) * 100, 2) AS Revenue_Goal_Achievement_Percentage,
    ROUND(AVG(Margin/Margin_Goal) * 100, 2) AS Margin_Goal_Achievement_Percentage
FROM
    df
GROUP BY
    Seller
"""

duckdb.sql(query)
Output:

4. Customer Conversion Analysis
Customer conversion rates per salesperson.
query = """
SELECT
    Seller,
    (SUM(Sales_Quantity) / SUM(Customers)) * 100 AS Conversion_Rate_Percentage
FROM
    df
GROUP BY
    Seller
ORDER BY
    Conversion_Rate_Percentage DESC;
"""

duckdb.sql(query)
Output:

Key Takeaways
| Topic | Summary |
|---|---|
| What is DuckDB | An in-process SQL OLAP database management system for analytical query processing |
| Why use DuckDB for sales analysis | Fast, simple, feature-rich, free, and integrates well with Python |
| How to use DuckDB for sales analysis | Load and query data from CSV files using DuckDB’s Python API and perform common sales analysis tasks using SQL |